You have 0 items in your cart

A CRM performance report is a structured summary that translates your CRM data into the specific metrics managers need to judge pipeline health, rep productivity, and customer outcomes. Think of it as the difference between staring at a raw spreadsheet full of deal names and actually knowing whether your quarter is on track. CRM reporting turns that data into structured reports that help people understand sales performance, marketing effectiveness, service quality, and customer behaviour.
TL;DR: A CRM performance report answers the question “how is the business actually performing?” using filtered, grouped data rather than a raw export.
Core components typically include:
- Pipeline metrics — deal volume, value, and stage distribution
- Conversion metrics — lead-to-opportunity and opportunity-to-close rates
- Velocity metrics — average deal cycle length and stage dwell times
- Retention metrics — churn rate, customer lifetime value, and renewal rates
- Activity metrics — calls, emails, meetings, and follow-up completion rates
Sales managers, marketing leads, operations teams, and senior leadership each consume these reports, though they tend to care about very different slices of the same data.
Table of Contents
- What should a CRM performance report contain?
- Which report type should you use, and when?
- How do you interpret a CRM performance report?
- Reporting versus analytics: why descriptive reports alone fall short
- How to build a CRM performance report for your SME
- Common pitfalls and a data-quality checklist
- How to turn report findings into actions
- Key takeaways
- Why most SME reporting setups quietly miss the point
- Smarterbusiness can build your CRM reports for you
- Useful sources and further reading
What should a CRM performance report contain?
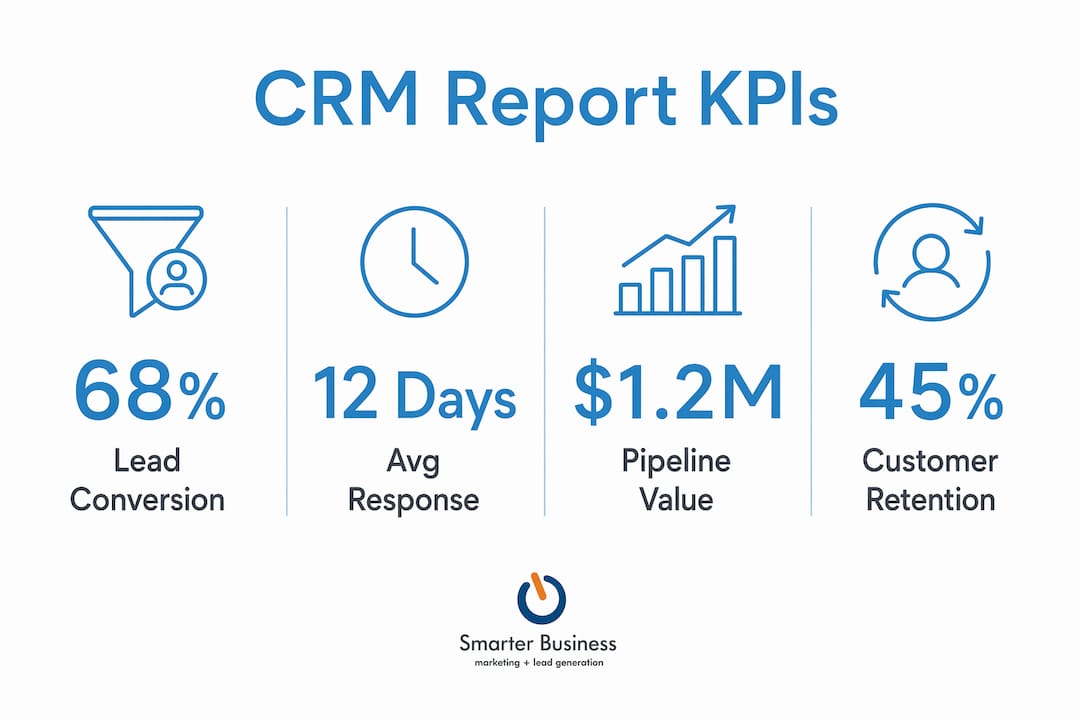
CRM reports summarise performance for a specified period and use visual elements to convert data into digestible insights. The table below groups the must-have KPIs by category, defines each one, and flags its primary use.

| Category | KPI | Definition | Primary use |
|---|---|---|---|
| Pipeline | Pipeline value | Total value of open deals by stage | Forecast revenue; spot gaps |
| Pipeline | Deal count | Number of active opportunities | Capacity and coverage planning |
| Conversion | Win rate | Closed-won deals as a % of total closed | Assess sales effectiveness |
| Conversion | Lead-to-opportunity rate | Leads that become qualified opportunities | Judge marketing and SDR quality |
| Velocity | Average deal cycle | Mean days from creation to close | Identify bottlenecks |
| Velocity | Stage dwell time | Average days a deal spends in each stage | Pinpoint where deals stall |
| Retention | Churn rate | % of customers lost in a period | Flag retention risk early |
| Retention | Customer lifetime value (CLV) | Projected revenue per customer relationship | Prioritise accounts |
| Activity | Calls and emails logged | Volume of outreach per rep per period | Coaching and workload review |
| Activity | Follow-up completion rate | % of scheduled follow-ups completed on time | Process discipline check |
Tactical metrics such as activity counts and stage dwell times suit daily or weekly review. Strategic metrics like CLV, win rate, and pipeline value belong in monthly or quarterly leadership discussions. Grouping metrics by category helps align reporting to operational decisions rather than vanity measures.
Which report type should you use, and when?
Not every question needs the same report. Using the wrong type is a bit like asking a weather forecast to tell you why it rained last Tuesday.
- Dashboards give a real-time visual snapshot of key metrics. Use them for daily stand-ups and quick health checks. Audience: sales managers and reps. A CRM reporting dashboard answers “what is happening right now?” rather than “what happened last quarter?”
- Funnel and conversion reports show where leads drop off across the pipeline. Use them weekly to identify stage-level problems and coach reps on qualification. Audience: sales managers and marketing leads.
- Activity reports log calls, emails, and meetings per rep. Use them weekly for coaching conversations. If a rep has a low win rate but high activity, the problem is quality, not effort.
- Cohort and retention reports group customers by acquisition period and track renewal or churn over time. Use them monthly or quarterly. Audience: operations and customer success.
- Forecasting reports project likely revenue based on pipeline stage and historical close rates. Use them monthly for leadership. They answer “will we hit the number?” rather than “did we hit it?”
Reports answer deeper questions while dashboards highlight changes at a glance. The practical rule: if a stakeholder needs to make a decision, give them a report with filters; if they need a pulse check, give them a dashboard.
How do you interpret a CRM performance report?
Start with the trend, not the number. A win rate of 28% means nothing without knowing whether it was 35% three months ago.
Common red flags and the immediate checks to run:
- Falling pipeline value — check whether new deal creation has slowed or whether deals are being lost earlier in the funnel
- Decreasing win rate — segment by rep, territory, and lead source to isolate whether the problem is systemic or localised
- Long stage dwell times — identify the specific stage where deals stall and review the activities logged there
- Low activity counts — distinguish between a data-entry problem and a genuine drop in outreach before drawing conclusions
- High churn in a specific cohort — cross-reference with onboarding dates, product type, or account manager to find the pattern
Benchmarks vary by industry and sales model, so segment before comparing. A lead response time that looks slow for a SaaS business may be perfectly normal for a complex B2B sale.
Pro Tip: Never judge performance from raw counts alone. Ten meetings logged by one rep may represent genuine outreach; ten meetings logged by another may be duplicates from a bulk import. Always filter by data source and entry date before drawing conclusions.
Reporting versus analytics: why descriptive reports alone fall short
Reporting tells you what happened. Analytics tells you why it happened and what is likely to happen next. That distinction sounds simple, but it is where most SME reporting setups quietly break down.
Industry analysis in 2026 identifies confusion between reporting and analytics as the primary reason CRM reporting fails: teams treat reports as static history rather than as dynamic tools paired with analytics and operational workflows.
A descriptive report shows that win rate dropped in March. A diagnostic question asks whether that drop correlates with a change in lead source mix, a new competitor, or a pricing adjustment. A predictive model flags which open deals are most likely to slip before the quarter closes.
A short roadmap for adding analytics to your reporting workflow:
- Diagnostic checks first — add a “reason lost” field and review it monthly. Patterns emerge faster than you expect.
- Simple predictive rules — flag any deal that has sat in the same stage for longer than your average cycle time. No machine learning required.
- Escalate to advanced analytics when you have at least 12 months of clean data and a specific forecasting question that descriptive reports cannot answer.
Sales managers need both. Leadership needs the predictive layer most urgently, because their decisions carry the longest lead time.
How to build a CRM performance report for your SME
The finished report must enable a specific decision. If you cannot name that decision before you build, stop and name it first.
Design checklist:
- Define the audience and the decision they need to make
- Choose the KPIs that directly inform that decision (use the table above)
- Identify the segments that matter (territory, rep, lead source, product line)
- Set the cadence (daily dashboard, weekly funnel report, monthly strategic review)
- Assign an owner who is responsible for distributing and acting on the report
Data checklist:
| Check | Required field or rule | Quick validation |
|---|---|---|
| Deal stage hygiene | Stage must match activity logged | Filter deals with no activity in 30+ days |
| Source attribution | Lead source required on every contact | Count records with blank source field |
| Timestamps | Close date and create date mandatory | Flag deals with close date before create date |
| Duplicate records | One contact per email address | Run duplicate-detection report monthly |
| Activity logging | Every call and meeting logged same day | Compare calendar entries to CRM activity count |
Build steps:
- Map your data structure to your business questions before creating a single saved filter. If you must manually join campaign costs to closed sales, your CRM configuration is incomplete.
- Build saved report filters for each audience segment rather than running ad-hoc queries.
- Apply consistent visual design: one chart type per metric category, colour-coded by RAG status where possible.
- Schedule automated distribution so reports reach stakeholders before meetings, not during them.
- Add a short “recommended action” field to each report so readers know what to do with the findings.
Pro Tip: Map the data structure to the business questions you need answered before building a single report. If the data is not there, the report cannot be either — fix the input before fixing the output.
Common pitfalls and a data-quality checklist
Unreliable reports are almost always a data problem wearing a reporting costume.
| Pitfall | Root cause | Quick fix |
|---|---|---|
| Pipeline value looks inflated | Stale deals never marked lost | Set a rule: no activity in 60 days = review required |
| Win rate swings wildly | Inconsistent stage definitions | Standardise stage names and entry criteria |
| Activity counts drop suddenly | Reps logging activity outside CRM | Mandate CRM-only logging; audit weekly |
| Source attribution is blank | Field not required at lead creation | Make lead source a required field |
| Duplicate contacts skew metrics | No deduplication workflow | Run monthly merge report |
CRM activity data is frequently less reliable than it appears, because manual entry gaps and inconsistent stage discipline compound over time. A quick fix handles the symptom; a CRM configuration change handles the cause. When the same pitfall reappears after a quick fix, request a configuration review rather than patching the report again.
Human process changes matter as much as technical ones. If the team does not understand why data hygiene affects their own performance reviews, they will not maintain it. Act! CRM training that ties data entry discipline to visible reporting outcomes tends to stick far better than a policy memo.
How to turn report findings into actions
Reading a report and filing it away is the CRM equivalent of buying a gym membership and never going. The point is what happens next.
Immediate post-report actions:
- Triage — identify the one or two metrics furthest from target and focus there first
- Investigate — segment the underperforming metric by rep, territory, and lead source before assuming a cause
- Act — assign a specific owner and a deadline for each finding; add it to the next team meeting agenda
- Measure — set a four-week checkpoint to assess whether the action moved the metric
For coaching, use activity reports and sales call performance data to identify whether a rep’s problem is volume, quality, or follow-through. A rep with high activity and low conversion needs a different conversation than one with low activity and average conversion.
For process experiments, change one variable at a time. If you shorten the follow-up window from five days to two, measure win rate and cycle time for the next 60 days before drawing conclusions. Changing multiple things simultaneously makes it impossible to know what worked.
Cadence suggestion: weekly triage of activity and pipeline metrics, monthly review of conversion and retention, quarterly strategic review of CLV and forecasting accuracy.
Key takeaways
A CRM performance report is only as useful as the decisions it drives: pair descriptive reports with diagnostic checks, maintain data hygiene as a prerequisite, and assign a named owner to every finding.
| Point | Details |
|---|---|
| Reports need a decision | Define the decision the report must enable before building it. |
| Group KPIs by category | Pipeline, conversion, velocity, and retention metrics each serve different stakeholders. |
| Pair reporting with analytics | Descriptive reports show what happened; analytics explain why and predict what comes next. |
| Data hygiene comes first | Required fields, stage discipline, and activity logging are prerequisites for reliable reports. |
| Smarterbusiness operationalises this | Smarterbusiness configures Act! CRM to align reports, workflows, and data structure to your business questions. |
Why most SME reporting setups quietly miss the point
Most managers I speak with have reports. What they lack is a report that actually prompts a decision. There is a meaningful difference between a screen full of charts and a document that tells a sales manager which three deals to call today and why.
The reporting-versus-analytics distinction is not a technical nicety for enterprise teams. For an SME with a lean sales operation, the ability to spot a stalling deal before it goes cold is worth more than any dashboard aesthetic. The businesses that get the most from their CRM are not the ones with the most reports; they are the ones where every report has a named owner, a clear question, and a follow-up action attached to it.
Data hygiene is where this either works or falls apart. No amount of clever reporting configuration rescues a CRM where reps log calls three weeks late and close dates are fictional. The template and checklist in this article are a starting point, but the real work is the human discipline behind the data.
Smarterbusiness can build your CRM reports for you
Getting CRM reporting right from scratch is genuinely tricky, especially when your data structure was never designed with reporting in mind. Smarterbusiness works with SMEs as a certified Act! CRM Consultancy, configuring reports, dashboards, and data workflows to match how your business actually operates rather than how a generic template assumes it does.

Services include custom report builds, Act! CRM configuration aligned to your sales process, and hands-on training that ties data entry discipline to reporting outcomes your team can see. Whether you need a single pipeline report or a full reporting framework across sales, marketing, and operations, the starting point is always the same: map the business question first, then build the report around it.
If your current reports feel more like archaeology than insight, talk to Smarterbusiness about a CRM reporting review.
Useful sources and further reading
- CRM Reporting: Essential Reports, Metrics and Best Practices — practical definitions of report types, KPIs, and best practices; good starting point for understanding report structure
- CRM Reports: Key Features, Benefits and How to Create Them — covers dashboards versus reports, scheduling, and how to make reports actionable
- CRM Data Analysis: Types, Metrics and How-To (2026 Guide) — the clearest explanation of the reporting-versus-analytics distinction and metric groupings; use this for the diagnostic and predictive layer
- SuiteCRM Reports Documentation — technical reference for saved reports, charting, and scheduled distribution; useful if you are configuring report modules yourself
- Your CRM Activity Data Is a Lie — sharp industry commentary on why activity data is less reliable than it looks; essential reading before drawing conclusions from activity reports
- Sales Call Rep Performance Improvement Guide — practical coaching framework for using call and activity data to improve rep performance